As a social marketing tool, StumbleUpon Paid Discovery (a.k.a. StumbleUpon ads) is underrated. Paid Discovery helps people who are likely to be interested in your infographic – or your clever article or how-to guide, etc. – find your infographic at a fraction of the cost of traditional promotional methods.
When we promote an infographic we use the following tactics:
- Outreach to industry and topic-related bloggers through email and twitter
- Search engine optimized press release, which is sent through MarketWire
- Sponsored tweets campaign targeting industry bloggers, journalists, etc.
- Facebook ad campaign that promotes our infographic to people with a stated interest in a relevant topic or industry
- Old-fashioned begging of colleagues, friends, and family members to post our infographic on Facebook, Twitter, blogs, etc.
- StumbleUpon Paid Discovery
Of all the methods we use, blogger outreach is by far the most effective. While promoting our recent American family debt facts infographic, we contacted dozens of financial and economic bloggers to great effect. The downside: Blogger outreach is incredibly time consuming.
StumbleUpon Paid Discovery, which is perhaps the least time-consuming and lowest-cost tactic, isn’t necessarily the second most effective tactic on our list. Often times, begging colleagues, friends, and family can give a new infographic a nice boost, and we’ve gotten lucky a couple of times with press releases, Facebook ads, and sponsored tweets. Yet when measured over the long term (six months or longer), Paid Discovery generated at least as many likes, tweets, and links an any other method listed.
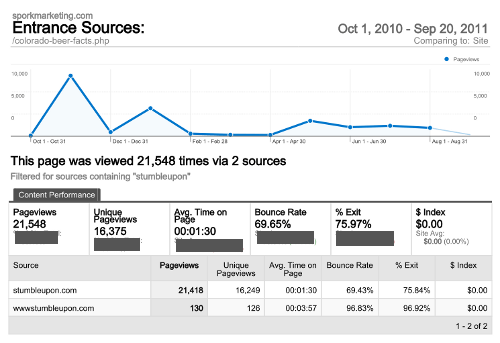
The reason that Paid Discovery is so effective is that it’s a great way to generate long-term traffic. Take a look at the StumbleUpon traffic report for our Colorado Beer Facts infographic we created and initially promoted via Paid Discovery in September 2010:
The graphic shows that StumbleUpon generated more than 20,000 page views for the Colorado beer infograhpic over the last year or so. These 20k+ views all stemmed from an initial investment in only 1,000 paid views in September 2010. When StumbleUpon users who see our content during our paid advertising give us a thumbs up, StumbleUpon rewards us with unpaid impressions. Over time, as more and more people thumbs up our content we gain more unpaid impressions. As you can see, our unpaid impressions exploded in October 2010 and again in January 2011.
During the last year, the number of Facebook Likes for our Colorado beer infographic has about doubled. We’ve seen a handful of tweets show up in our alerts, and despite no active promotion, the infographic continues to be embedded by other website owners (albeit at a slow pace). While it’s hard to attribute all of these likes, tweets, and embeds directly to our initial investment in Paid Discovery, StumbleUpon is the largest source of traffic for this particular page. Other content we’ve promoted via Paid Discovery shows similar results, so it seems to be a great ongoing link building and social marketing tool.
Tips For Using Paid Discovery To Promote Your Infographic
First, Paid Discovery has three different pricing levels, but all levels allow you to show your content to users by their stated interest. Investing in the “standard” pricing level allows you to learn things about how each targeted audience interacted with your content, which can help you figure out the interest area that best matches your infographic. Typically, we’ll identify three to five interest areas, and then purchase 300 or so impressions for each interest area at the “standard” price level. A few hours later, we have data that shows interactivity for each interest area, which we can use to buy more paid impressions at the lower price level. Basically, we run a test at the higher price, and then spend more money on a lower-priced bracket when we know which interest areas are likely to generate traffic long-term.
Next, we’ve found that it’s critical to target one interest area per campaign. This allows you to see which interest area generates the best response, which allows you to target additional spend accordingly. For the American family debt infographic mentioned earlier, we targeted StumbleUpon users with an interest in banking, economics, and financial planning. Of the three, users with an interest in economics were the most engaged and the most likely to share our graphic on Facebook or Twitter.
Also, remember that you can use the demographic data gathered from your Paid Discovery campaign to inform your Facebook ad targeting (and vice versa). If males over 40 were more likely to interact with your graphic than males under 40, you can adjust your Facebook ad bids accordingly. Obviously, it’s only wise to do this sort of thing if you have enough data.
There are also some general tips that can make or break your infographic in terms of Paid Discovery:
- Get the content as high up on the page as possible. Infographics almost always stretch below the fold, but the more of the graphic that you can get above the fold the better.
- Social proof: Showing the number of Facebook Likes at the top of the page can also get Stumble users to stick around and view your graphic.
- Make sure you do everything you can to make the content load as quickly as possible. If the graphic doesn’t load fast, Stumble users will just leave.
Finally, the more you use Paid Discovery to promote content the more you can use it to figure out when you have content that isn’t working. When an investment in paid StumbleUpon impressions doesn’t generate any free stumbles, it’s a signal that the campaign is targeting the wrong interest area or the content needs improvement.


